Sales Compensation Plan: A 2026 Guide for RevOps and Finance Leaders
.webp)
The real decision in sales compensation is not what to pay. It is how to pay in a way Finance can defend, RevOps can scale, and reps can trust.
In 2024, only 51% of SaaS account executives hit quota, down from 66% in 2022 (Bridge Group). That is not a math problem. It is a design problem.
Most plans break not because the rates are wrong, but because the structure cannot survive a new product line, a territory change, or a quarterly close.
A sales compensation plan is the operating contract between Finance, Sales, and the rep. Get it right, and you reduce audit risk and forecast more clearly. Get it wrong, and you inherit reconciliation hours, payout disputes, and rep attrition.
A comp plan is not a spreadsheet. It is a system.
This guide covers:
- The four-layer framework: pay architecture, quota mechanics, behavioral levers, governance
- 2026 OTE and pay-mix benchmarks by role (SDR, AE, Sales Manager, CSM, SE)
- Which compensation structure fits your sales motion, and how to model the cost
- A six-point checklist before rolling out a new plan
- The six most common mistakes that break comp plans in production
What are the core components of a sales compensation plan?
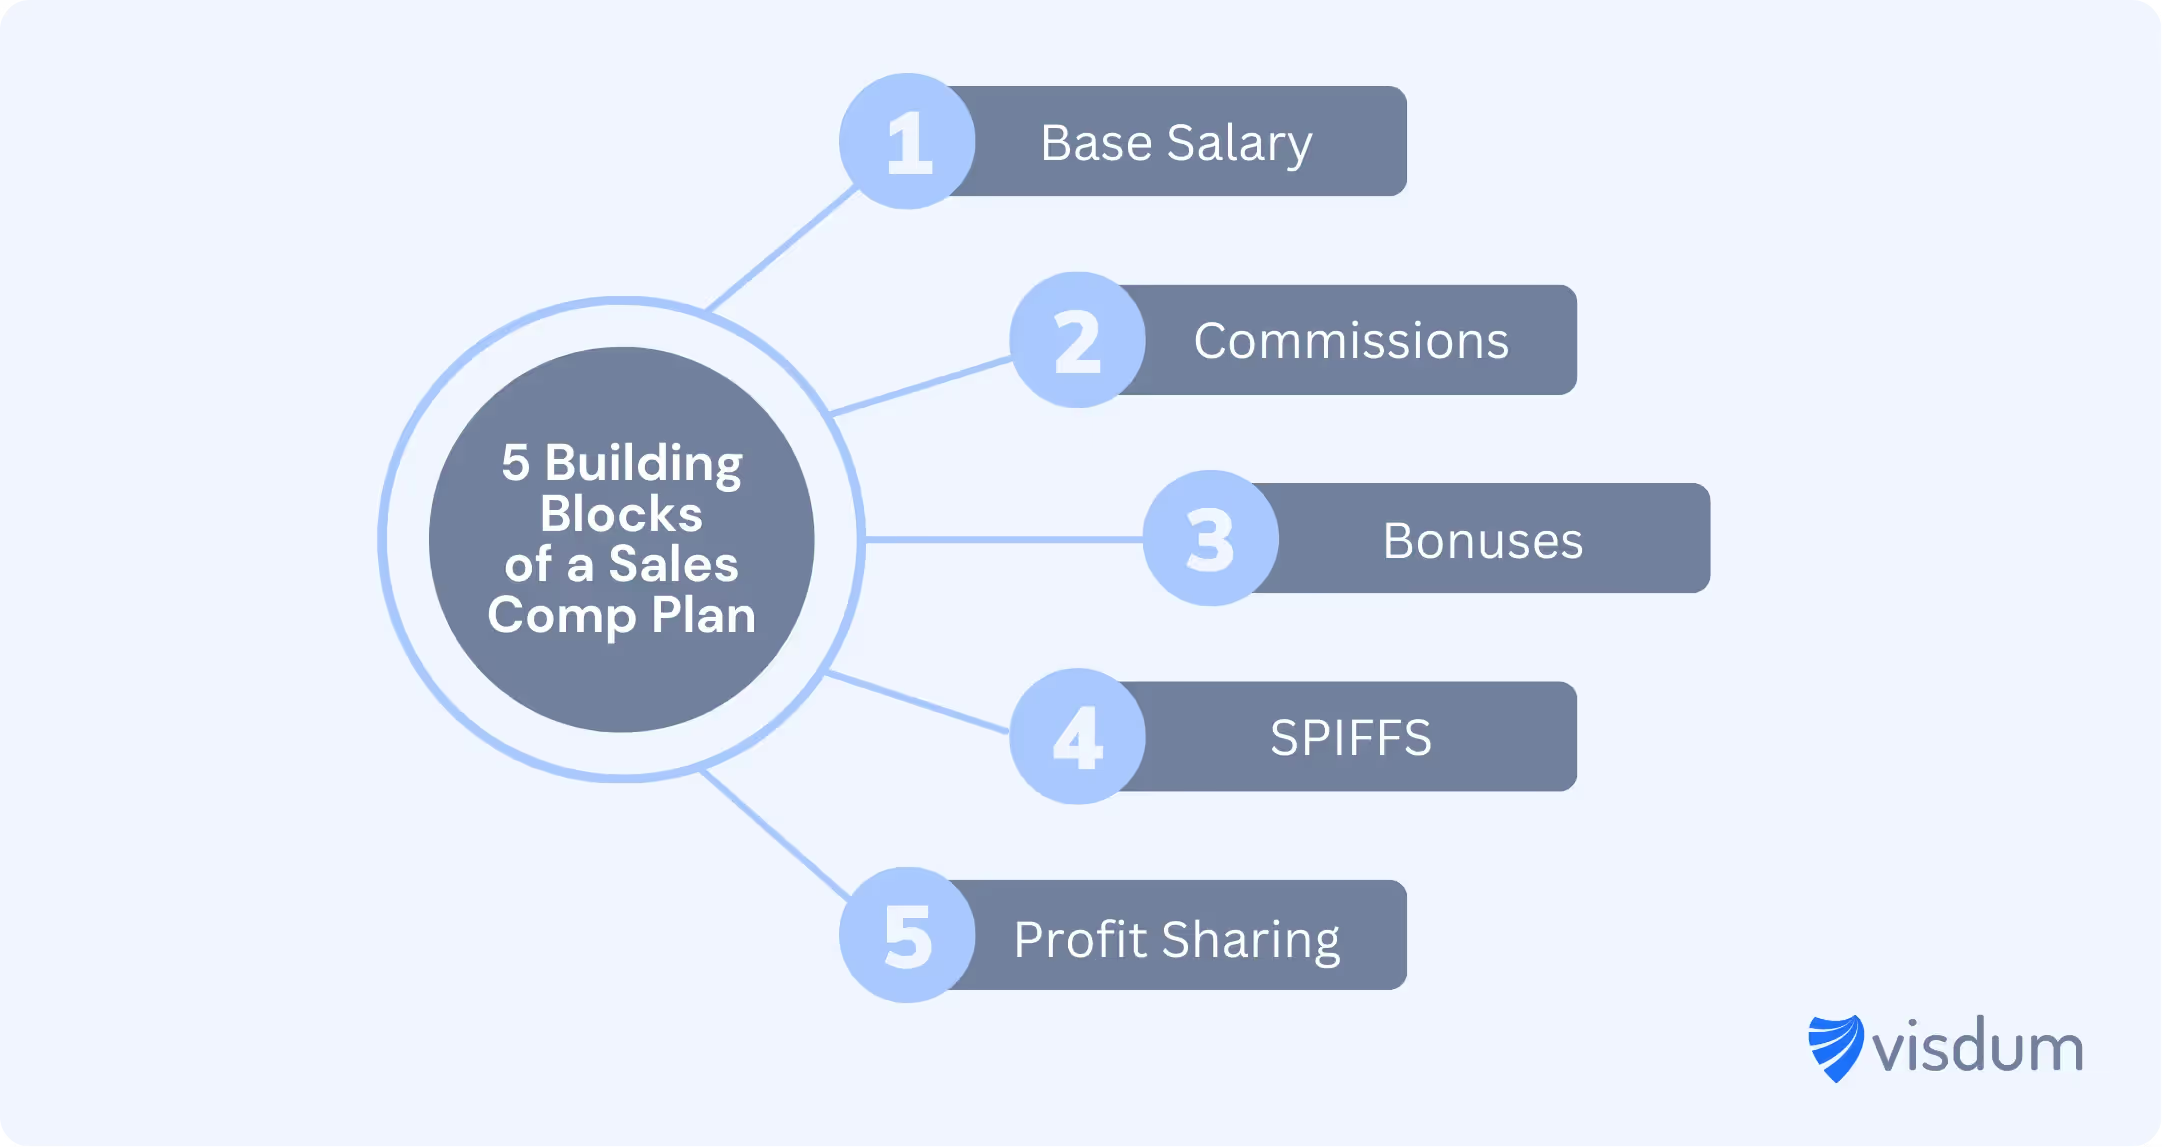
Every sales compensation plan, regardless of industry, is built from the same five components. The real question is how you weight them.
Base salary
Base is the fixed, predictable pay component, paid regardless of performance. It funds the rep's life and stabilizes the operating cost line for Finance.
Median SaaS AE base in the US is around $100K (RepVue, 2026). SDR base typically runs $50K to $60K. Enterprise AE base sits between $100K and $130K depending on segment and location.
Base matters more than founders think. Set it too low, and you cannot recruit. Set it too high, and you lose the variable lever that drives sales behavior.
Commissions
Commissions are the variable-pay layer that ties rep earnings to revenue outcomes. They are calculated on a percentage of revenue, gross margin, or units sold, depending on the structure.
Commission design is where most plans break. A 10% rate on new ARR looks simple in a deck. In production, you discover splits, holdovers, deal slippage, partial-quarter starts, and territory changes that the spreadsheet cannot handle cleanly.
Bonuses
Bonuses are fixed or threshold-based payments tied to specific outcomes. Examples: a $5,000 bonus for hitting quarterly quota, a $10,000 bonus for closing the first deal in a new product line, a $2,500 team bonus for hitting a regional target.
Bonuses are most useful when you need to drive a specific behavior that commission rates alone will not motivate.
SPIFFs
SPIFFs are short-term, time-bound incentives that push a specific behavior, usually for 30 to 90 days. Common use cases: pushing a new product launch, clearing inventory, closing renewals before quarter-end, or driving multi-year contract terms.
SPIFFs work because they are urgent and narrow. They fail when finance teams use them as permanent compensation rather than tactical tools.
Equity and profit sharing
Equity is most common at Series A through C SaaS companies, where cash base pay is constrained but stock value is high-upside. Profit sharing is more common at PE-owned and bootstrapped companies where revenue maturity allows margin-based payouts.
Both components reward long-term retention rather than monthly performance. Neither replaces a primary commission structure.
Which sales compensation structure should you use?
The structure question is the first architectural decision. Get this wrong, and every downstream choice (quota, accelerators, governance) will be patching the wrong foundation.
Compensation structure comparison
Straight salary
100% base, no variable. Best for roles where the sale cycle is long, multi-stakeholder, and difficult to attribute to a single rep. Common in strategic accounts, named-account models, and high-ticket enterprise sales.
The tradeoff: Finance carries the full payroll cost regardless of revenue.
Commission-only
0% base, 100% variable. Common in real estate, channel sales, and high-velocity transactional models. Reps carry all the income risk.
This structure rarely fits B2B SaaS. Recruiting suffers, ramp is brutal, and retention is unpredictable.
Salary plus commission
The default B2B SaaS structure. Pay mix shifts by role: 50/50 for AEs, 60/40 or 70/30 for SDRs, 80/20 for CSMs.
This is the most common structure because it balances rep predictability with company cost flexibility. It also requires the most discipline in commission design, since the variable lever is doing the work.
Tiered commission
Commission rate increases at quota attainment thresholds. Example: 8% up to 100% quota, 12% from 101% to 150%, 16% above 150%.
Tiered structures push reps to overperform but raise cost-of-sales when the team hits aggressively. Finance teams should model the cost at 120% team attainment, not 100%.
Draw against commission
The rep receives a guaranteed minimum payment, typically during ramp or new-territory periods. Future commissions are reduced until the draw is recovered.
Useful for new hires. Risky if the rep never recovers the draw and you have to write it off.
Profit margin-based
Commission is calculated on gross margin rather than revenue. Common in services, hardware, and discount-heavy B2B models.
This structure removes the incentive to discount aggressively. It requires deal-level margin visibility, which most CRMs cannot deliver without finance involvement.
Hybrid
A custom blend of two or more structures, usually combining base, commission, accelerators, and quarterly bonuses. Most mature SaaS plans are hybrids.
Hybrid plans work when communicated clearly. They fail when reps cannot explain their own plan in 90 seconds.
What are the design principles for an effective sales compensation plan?
Five principles separate plans that scale from plans that quietly break -
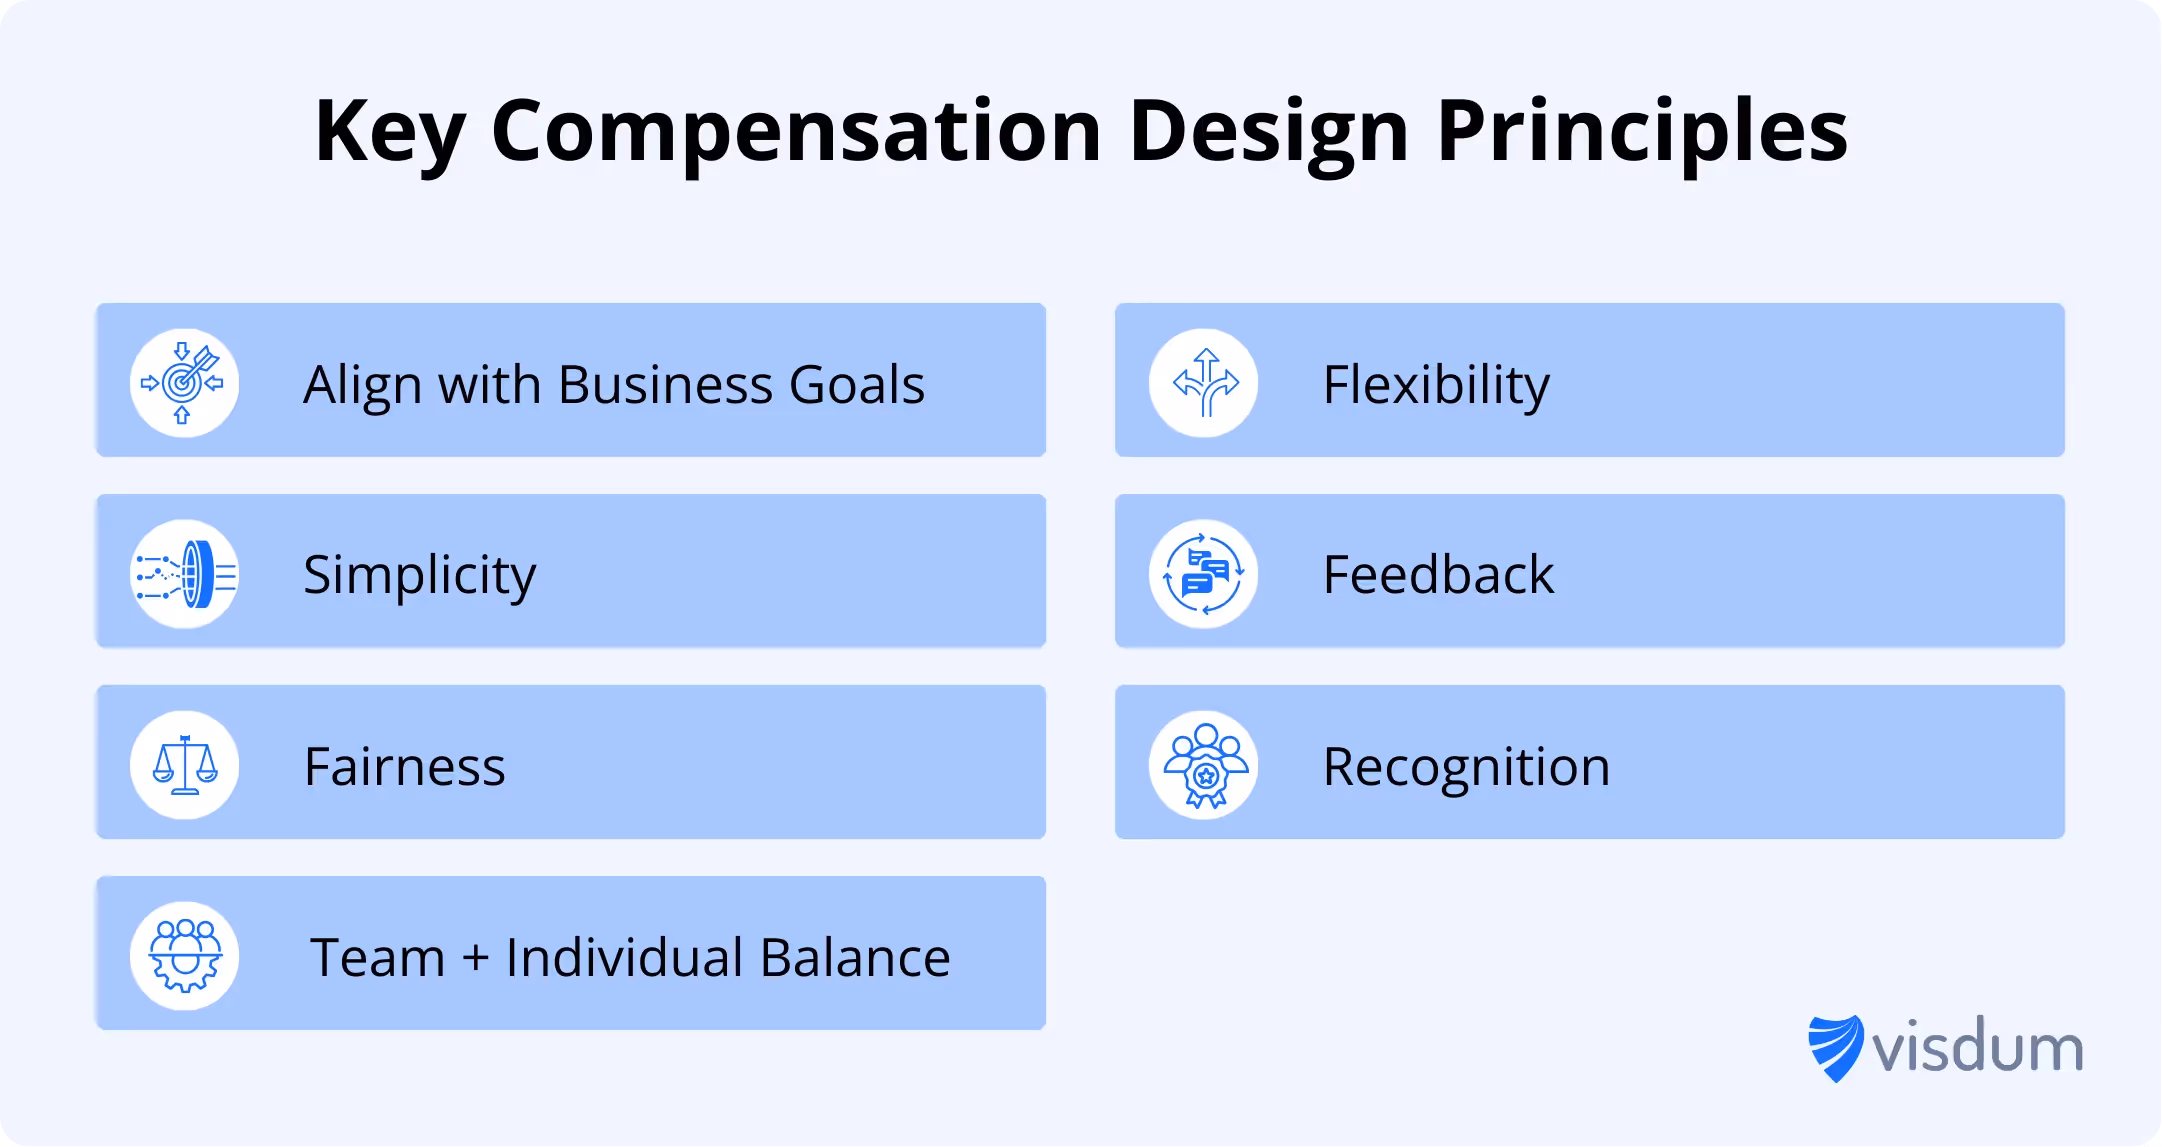
Tie the plan to revenue strategy
Every compensation lever should reinforce a business outcome. If the goal is new logo growth, weight commissions on new ARR. If the goal is retention, weight CSM pay on NRR. If the goal is upsell, build accelerators on expansion.
A plan that pays for activity rather than outcome is a plan that funds motion without revenue.
Keep it simple
97% of sales leaders say unclear comp plans hurt team morale (QuotaPath). Complexity is the silent killer of trust.
A rep should be able to explain their own plan in 90 seconds. Finance should be able to reconstruct any payout from the last 12 months without opening a Slack thread.
Balance individual and team outcomes
Individual commissions drive personal accountability. Team or pool components drive collaboration on multi-rep deals, region-level forecasts, and product launches.
Most healthy SaaS plans run 80% to 90% individual and 10% to 20% team or pool components.
Make the math transparent
Sales comp expert Chris Goff put it plainly on the Advanced Selling Podcast: the default seller mindset is distrust. Reps assume the company will get the comp math wrong, and they look for ways to verify the payout themselves. Reps tolerate lower pay if they trust the math. They quit when payouts arrive without explanation.
Transparency means three things: visible plan documents, real-time attainment dashboards, and a documented dispute process. None of these are optional.
Build in flexibility
Revenue models change. Product lines launch. Territories shift. A plan that cannot be amended mid-year without breaking the spreadsheet is a plan that will be amended mid-year and break the spreadsheet.
Flexibility comes from documented version control, scenario modeling, and the ability to issue mid-year amendments without re-pulling 12 months of historical commission data.
How should sales compensation plans differ by role?
Role-specific design is where most plans fail in practice. Treating every seller like an AE drives misaligned behavior and inflated payroll.
Role-by-role pay mix and OTE benchmarks (2026)
SDR and BDR
SDR compensation is shifting in 2026. ICONIQ Growth reports that over 60% of SaaS companies now tie SDR pay to pipeline quality (qualified opportunities, conversion rates, sourced ARR) rather than meetings booked.
The pay mix runs 65/35 to 70/30, with most of the variable tied to qualified opportunities sourced and accepted. Annual quota lives between 3x and 4x OTE.
AE (Mid-Market and Enterprise)
The AE plan is the most studied compensation structure in SaaS. Pay mix is 50/50 by default. Quota runs 4x to 8x OTE depending on segment maturity and average deal size.
82% of companies now offer accelerated commissions that boost payout 20% to 30% once reps exceed quota (ICONIQ, 2024). Accelerators are no longer optional in competitive markets.
Sales Manager
Sales Manager compensation is usually weighted on team attainment rather than personal selling. Pay mix runs 60/40 or 70/30, with variable tied to team quota, region attainment, and team retention metrics.
A common error: paying the manager 100% on team revenue without protecting them from one underperforming rep. Build in a floor based on team-average attainment, not single-rep outcomes.
CSM and Account Manager
CSM pay is shifting from retention-only to NRR-based. Pay mix is 70/30 or 80/20, with variable tied to gross retention, net retention, and expansion ARR.
If your CSMs are paid only on logo retention, expansion will quietly stall. NRR-weighted plans solve that.
Sales Engineer
SE pay is usually tied to the AE quota they support. Pay mix is 70/30 or 80/20, with variable calculated as a multiplier on the supported AE's attainment.
SEs do not own quota directly, but their pay should move with the deals they help close.
Example: a 2026 mid-market AE plan
- Role: Mid-market AE at a SaaS company
- OTE: $180,000
- Pay mix: 50/50 ($90K base, $90K variable)
- Annual quota: $900,000 in new ARR (5x quota-to-OTE ratio)
- Commission rate: 10% of new ARR on closed-won deals
- Accelerator: 1.5x rate above 100% quota attainment, capped at 200%
- Clawback: 100% repayment if customer churns within 90 days
- Payout cadence: Monthly, with a 30-day finance review window
This plan reads simply. In production, it requires version control on the accelerator, a clawback workflow, deal-level commission attribution, and a system of record that Finance can audit.
How do you roll out a new sales compensation plan?
A new plan is judged not by its design, but by its rollout. Most plans fail in the first 30 days because the implementation was rushed.
Plan design checklist before rollout
Communicate early
Reps should see the plan, the math, and the rationale before the fiscal year begins. The minimum:
- A written plan document
- A worked example showing how a typical deal pays out
- A clear explanation of what changed from last year and why
Timing matters. Plans published in the first week of the new fiscal year land badly. Plans shared four to six weeks before year-end give reps time to model their own earnings, ask questions, and internalize the targets before the new year starts.
The fastest way to lose a top performer is a surprise mid-year plan change with no prior notice. The second fastest is a new plan that reps receive on day one with no context, no examples, and no clear path to asking questions.
Surprise plan changes are not just a morale problem. They are a trust problem that compounds every quarter.
Time the rollout
The default rollout window is the start of the fiscal year, with the plan document published four to six weeks ahead and finalized one week before launch. This gives Finance time to load the new logic into the comp engine, RevOps time to set territory and quota, and reps time to question what they do not understand.
Mid-year changes are appropriate for three triggers:
- A new product line that needs separate compensation logic
- A pricing change that materially shifts deal economics
- A market shock (regulatory, competitive, macroeconomic) that invalidates the original quota assumptions
Everything else is tuning, and tuning belongs in the next annual cycle.
Plans launched without warning at the start of a quarter create a predictable pattern. Reps spend the first month decoding the plan instead of selling. The first dispute lands by week six. Finance loses two cycles of close on top of normal rollout work.
The cost of waiting one quarter to roll out cleanly is almost always less than the cost of fixing a rushed launch.
Train the team
Every rep should walk through their plan with a manager in week one. The walkthrough is not a slide deck. It is a worked example using the rep's territory, projected pipeline, and quota, showing exactly what attainment scenarios produce what payouts.
Managers need their own training first. A manager who cannot explain the accelerator math, the clawback trigger, or the dispute path cannot defend the plan when a rep challenges it. Comp design teams should run a manager session two weeks before reps see the plan.
Every payout in the first 90 days should be reviewed live, not pushed silently to a payroll file. Reviewing means a five-minute conversation showing the rep how their attainment translated into the dollar figure on the statement. This is the cheapest possible investment in long-term trust.
Edge cases need worked examples before they occur, not policy decisions during a live dispute:
- Deal slippage and partial-quarter starts
- Mid-quarter territory moves
- Splits on multi-rep deals
- Clawback timing on early-churn customers
Use the right tools
Nearly 70% of companies still use spreadsheets to manage commissions. The cost shows up in three places:
- Audit findings during annual review
- Reconciliation hours that scale linearly with rep headcount
- Rep disputes that take days rather than minutes to resolve
Spreadsheets fail in predictable ways:
- They cannot version-control mid-year plan amendments
- They cannot reproduce a payout calculation from 18 months ago when a former rep files a dispute
- They do not amortize commissions under ASC 606 without a parallel manual workbook
- They break the moment one analyst leaves and another inherits the file
The fix is not a better spreadsheet. It is a system of record for sales commissions that holds plan logic, payout calculations, dispute records, and amortization schedules in one place. Modern platforms also layer in an AI copilot for commission analytics so RevOps and Finance can answer payout questions without pulling reports.
Migrating off spreadsheets is not a Q4 project. It is a planning-cycle project. Teams that wait for "after this quarter's close" rarely make the move at all.
Plan for pushback
Reps will challenge new plans. Build a documented dispute and clawback process before the plan launches, not after. The first dispute will set the precedent for every dispute that follows.
A defensible process has four elements:
- A single intake channel, not Slack DMs
- A stated resolution SLA, typically five to ten business days
- A written escalation path for unresolved disputes
- An audit log of every dispute filed and how it resolved
Write the position on common dispute triggers before launch, not during:
- Territory disputes after a mid-year change
- Split disagreements on multi-rep deals
- Clawback timing on early-churn customers
- Quota credit for deals closed in transition periods
Reps who file disputes are not the problem. Reps who go silent and start interviewing are. A clean dispute process surfaces the friction before it becomes attrition.
Monitor and adjust
Plan performance should be reviewed quarterly. The four metrics that matter:
- Attainment distribution across the team
- Cost-of-sales as a percentage of revenue
- Average ramp time from hire to first quota hit
- Rep retention by tenure cohort
Healthy distributions look like a bell curve centered on 80% to 100% attainment, with 10% to 20% of reps exceeding 130% and 10% to 20% below 50% (typically ramp-stage reps or genuine performance issues). A flat distribution where most reps cluster below 60% signals the quota is wrong, not the team.
If 80% of reps are below 50% attainment in Q1, the plan is wrong, not the team. The mistake most leaders make at that point is launching a performance cycle. The correct move is to audit the quota and pipeline coverage first.
Reviewing without acting is worse than not reviewing at all. Set a default rule: any quarterly review that surfaces a problem produces either a documented amendment or a documented decision not to act. Both are valid. Silence is not.
Document everything
Every version of the plan, every amendment, every approval signature, every commission calculation. Finance teams that cannot reconstruct a payout from 18 months ago fail their first audit.
The documentation minimum:
- A versioned plan document with change logs
- Signed acknowledgments from every rep for every active plan version
- Calculation logic that can be reproduced from inputs alone
- A dispute log that links every resolved case to the underlying calculation
The hardest part is not creating documentation at the start. It is maintaining it through territory changes, role transitions, plan amendments, and rep departures. For automated plan-signature workflows, see the DocuSign and Visdum integration for sales commission.
The test: pick a payout from 18 months ago at random. If Finance cannot walk through who earned it, on what plan version, against what quota, with what credit attribution, in under ten minutes, the documentation is not yet at audit standard.
What are the most common sales compensation plan mistakes?
Six errors account for most plan failures. Every one of them is avoidable.
Overcomplicating the plan
A Series C SaaS company built an AE comp plan with 14 components:
- Base salary and variable
- Three quota tiers
- Two accelerator brackets
- A decelerator on discounted deals
- A SPIFF for multi-year contracts
- A kicker for new logo vs expansion
- A clawback schedule
- A draw structure
- An MBO bonus
- A team pool
- A quarterly bonus on pipeline coverage
Onboarding required a 90-minute walkthrough with a finance analyst. Reps still got their plans wrong six months in. The first quarter produced 23 commission disputes across 18 reps.
The redesign cut the plan to four components: base, variable, accelerator, and clawback. Disputes dropped to two per quarter. Attainment did not move.
Complexity feels sophisticated to the comp designer and unfair to the rep. Strip every clause that does not directly drive a revenue behavior. If a clause is there to control for an edge case that happens twice a year, document the edge case separately and keep the plan clean.
Misalignment with revenue strategy
A $45M ARR SaaS company had this CSM compensation setup:
- Annual CSM commission spend: $1.2M
- Gross retention: 92%
- NRR: 103%
- Expansion revenue: $180K
- Estimated expansion potential: $2M to $3M
- Variable tied to expansion: $0
The plan was technically working. Retention was strong. But expansion had no incentive attached to it.
The fix took one quarter: shift 30% of CSM variable to NRR attainment. Within two quarters, expansion ARR increased 40%.
Logo retention and NRR are not the same metric. Paying for one while hoping for the other is not a comp plan problem. It is a strategy problem expressed through comp.
Audit your comp plan against your current revenue plan annually. If the company priority has shifted (new product, expansion motion, net revenue retention) and the comp plan has not, you are funding motion in the wrong direction.
Unrealistic quotas
A 40-person AE team at a growth-stage SaaS company set $1.4M annual quotas: an 8x quota-to-OTE ratio against $175K OTE. Leadership modeled the cost at 100% attainment.
Six months in, the attainment distribution looked like this:
- 4 reps above 80% attainment
- 11 reps between 50% and 80%
- 25 reps below 50%
- Team-average attainment: 41%
Sales leadership prepared performance cycles for the bottom 25. The audit found the problem was upstream of the reps:
- Pipeline coverage was 1.8x against a healthy bar of 3x
- Average deal size was 22% below the model's assumption
- Win rate was on plan, but volume of qualified pipeline was not
The quota was set against an opportunity that did not exist.
In 2024, only 51% of SaaS AEs hit quota (Bridge Group). Healthy plan design targets a distribution where 60% to 70% of reps hit full quota. If team-wide attainment falls below 50%, the quota is the problem, not the team. Audit pipeline coverage, deal-size assumptions, and territory potential before launching any performance cycle.
Ignoring rep feedback
Eight months into a new comp plan, a RevOps team noticed a clustering pattern in their dispute log. Six of eleven disputes that quarter centered on the same issue: a clawback clause triggering on deals where the customer downgraded but did not churn.
The clause had been written for a different product mix in the previous fiscal year. The current product had a 60-day downgrade window the clause did not account for. Every AE who closed an expansion deal in that segment was getting clawed back on the partial downgrade.
The fix was a 30-minute conversation and a one-line plan amendment. The plan had been live for eight months before anyone in Finance flagged it.
Reps see the plan in production every day. They will flag what is broken before Finance does:
- The broken accelerator
- The unclear clawback
- The impossible territory
- The deal that should have been a split but was not
Build a quarterly feedback loop with a documented intake channel, and watch for dispute clustering. Three disputes on the same clause is not three complaints. It is one design problem.
Not updating the plan
A SaaS company set its AE comp plan in 2021 and never touched it. The company changed underneath it:
Reps were still being paid 10% on new ARR with no separation between annual and multi-year terms, no separate logic for usage revenue, and no accelerator structure built for enterprise deal sizes.
The result: top performers were earning less per dollar of revenue closed than they had at plan creation. Three of the five highest-performing AEs left within twelve months for competitors with plan structures that matched the deal profile.
A comp plan that has not been touched in two years is either perfect or drifting. Plans should be reviewed annually and stress-tested against new product lines, pricing changes, deal-size shifts, and territory restructures. The cost of not updating is rarely a budget overrun. It is the quiet attrition of the reps who notice first.
Hiding the math
A mid-market AE closed a $220K multi-year contract in Q2. Her statement that month showed a payout 30% lower than her own back-of-envelope math.
She asked her manager. Her manager pulled in finance. Finance explained the deal had:
- A partial-quarter start that pro-rated her credit
- A multi-year discount adjustment she had not been briefed on
- A downstream credit attribution she had not been aware of
The math was correct. The communication was not. She left for a competitor four months later. Her exit interview cited "I can never tell what I am actually going to make."
Comp plan opacity is the top driver of rep distrust. The most common complaint is not the rate. It is not understanding how the payout was calculated.
Every rep should have access to:
- Real-time attainment dashboards
- Deal-level commission attribution
- A documented dispute path
None of this should require a ticket to Finance. Reps tolerate lower pay if they trust the math. They quit when payouts arrive without explanation.
What are advanced sales compensation strategies?
Once the foundation is in place, advanced design levers can sharpen revenue behavior.
Accelerators and decelerators
Accelerators boost the commission rate above quota. Decelerators reduce the rate on discounted or below-target deals.
A common pairing: 1.5x accelerator above 100% attainment, 0.75x decelerator on deals with discounts above 20%. This rewards over-attainment while protecting margin.
Quota setting based on historical attainment
Quotas built from last year's pipeline data outperform quotas built from a top-down revenue target. The right approach blends both.
Healthy design: set the top-down number, then validate against historical rep performance, current pipeline coverage, and territory potential.
Multi-dimensional measurement
Pay reps on more than one metric. Common combinations: new ARR plus product mix, total revenue plus margin, attainment plus customer satisfaction.
Multi-dimensional plans work when the metrics reinforce each other. They fail when the metrics conflict, which is why every multi-metric plan needs a clear primary and secondary weighting.
Special rewards for top performers
The top 10% of any sales team drives a disproportionate share of revenue. Reward them with President's Club, tiered accelerators, and high-multiplier overrides.
Losing a top performer to a competitor with a better plan is more expensive than overpaying that performer.
Data-driven compensation design
Modern comp design runs on three data streams: rep-level performance, deal-level attribution, and cohort-level retention. Plans built on these streams are easier to defend, easier to amend, and easier to audit.
This is the operational gap most spreadsheet-based plans cannot close. Mature teams replace the spreadsheet with a purpose-built sales compensation platform like Visdum before the next planning cycle, not after.
Final word: comp plan design as operating discipline
A sales compensation plan is not a spreadsheet. It is the operating contract that aligns Finance, RevOps, and Sales around a single revenue strategy.
The four-layer framework holds: pay architecture sets the cost structure, quota mechanics sets the revenue target, behavioral levers drive rep performance, governance sets the audit posture.
Get all four right and the plan becomes a forecasting asset rather than a quarterly fire drill.
The operational gap most mature plans eventually hit: plan logic, attainment tracking, clawback management, and ASC 606 amortization cannot coexist reliably in spreadsheets. Companies processing commissions for 30 or more reps typically need a dedicated commission system of record, one that holds plan logic, calculation history, dispute records, and audit trails in one place.
For teams evaluating that move, our sales commission software comparison breaks down the leading platforms by use case, pricing model, and implementation complexity.
.webp)
About the Author
Sameer Sinha is the Cofounder and Head of Product at Visdum, a leading SaaS platform for sales compensation automation used by mid-market and enterprise companies. With over two decades of experience across enterprises like Oracle and Citibank, as well as scaling startups, he has deep expertise in enterprise sales, finance, and RevOps, and brings a practitioner’s perspective to solving complex commission challenges.
He works closely with Finance, Sales, and Operations leaders to design scalable compensation programs, streamline data integrations across CRM, ERP, and HRIS systems, and drive transparency in incentive payouts. His insights span commission plan design, quota and territory planning, payout governance, and system architecture for high-scale environments. Sameer regularly writes about sales compensation strategy, SaaS integrations, and building data-driven revenue operations systems, helping organizations move from spreadsheet-driven processes to automated, audit-ready platforms.
FAQs
What is a sales compensation plan?
A sales compensation plan is the documented structure that defines how sales reps earn pay based on performance. It includes base salary, variable commission, bonuses, SPIFFs, and equity. The plan sets quota, payout cadence, and rules for accelerators, clawbacks, and disputes. A good plan aligns rep behavior with revenue strategy and is built to survive audit.
What are the main types of sales compensation plans?
The seven most common structures are straight salary, commission-only, salary plus commission, tiered commission, draw against commission, profit margin-based, and hybrid. Salary plus commission is the default for B2B SaaS, usually at a 50/50 pay mix for AEs. Hybrid plans are most common in mature organizations with complex product lines.
What does 60/40 mean in sales compensation?
60/40 means 60% of the rep's on-target earnings come from base salary and 40% from variable commission. For an AE with $200K OTE on a 60/40 mix, that is $120K base and $80K variable at target attainment. 50/50 is more common for AEs, while 60/40 and 70/30 are typical for SDRs, sales managers, and CSMs.
What is the average OTE for a SaaS sales rep in 2026?
Median SaaS AE OTE is $190K (Bridge Group, 2024), with mid-market AEs at $160K to $190K and enterprise AEs at $220K and above. SDR OTE typically lands at $85K. Sales Manager OTE ranges from $200K to $260K. CSM OTE sits between $130K and $170K. Numbers vary by company stage, geography, and product price point.
How often should you update a sales compensation plan?
A sales compensation plan should be reviewed annually at the start of the fiscal year. Mid-year amendments are appropriate for material changes such as new product launches, pricing shifts, or territory restructures. Avoid unnecessary mid-year tuning. Frequent changes erode rep trust and create version-control debt for Finance.
What is a healthy quota-to-OTE ratio?
In SaaS, AE quotas typically run 4x to 6x OTE for mid-market and 5x to 8x for enterprise. SDR quotas run 3x to 4x OTE. The ratio should produce a 60% to 70% on-target attainment rate across the team. If fewer than half of reps hit quota, the ratio is too high. If most reps exceed 130% attainment, the ratio is too low.
How do you build a sales compensation plan from scratch?
Start with revenue strategy, then work down through four layers: pay architecture (base, variable, OTE), quota mechanics (quota-to-OTE ratio, attainment expectations), behavioral levers (accelerators, decelerators, SPIFFs, bonuses), and governance (audit trail, version control, dispute process, ASC 606 compliance). Validate against benchmark data, model the cost at 80% and 120% team attainment, and rehearse the rollout before publishing.
What is an accelerator in a sales compensation plan?
An accelerator is a higher commission rate that activates once a rep exceeds quota. Example: 10% rate up to 100% attainment, 15% rate from 101% to 150%, 20% above 150%. Accelerators reward over-performance and are now standard in SaaS. 82% of companies offer accelerators that boost payout 20% to 30% above quota (ICONIQ, 2024).
How does ASC 606 affect sales compensation plans?
ASC 606 requires companies to amortize commission expense over the period that the customer relationship is expected to generate revenue, often three to five years for SaaS contracts. Commissions paid in cash up front cannot be expensed up front for accounting purposes. The plan should be designed so commission events, contract terms, and amortization schedules are captured automatically, not reconstructed at audit time.
.webp)

.webp)

