Key Sales Metrics For High-Performing Sales Teams in 2025

Sales are hard. Every founder knows that getting your product/service right and finding product-market fit is only the first stage.
The real battle starts after that- a long and continuous process of building, operating, and growing a high-performing sales team that can grow your revenue year-on-year. It is in this journey that directions can often be confused, and success signals might become opaque.
Sales metrics serve as beacons that reassure sales teams whether their activities are contributing meaningfully to the organization, and signal founders whether their vision is on track. More than 40% of sales representatives monitor their key performance indicators (KPIs) on a weekly basis.
While there are a lot of sales metrics, this guide will group them into functional areas in sales to better our understanding. So let's dive in!
What are Sales Metrics/Sales KPIs?
Sales metrics or KPIs are the data points and numerical figures that demonstrate sales performance against pre-established goals. They are used to measure sales performance and productivity on an individual, team, and departmental basis.
Tracking sales metrics is crucial because:
- They show whether the current strategy is working or not (performance tracking).
- They help identify areas for improvement and training.
- They help businesses forecast business income (revenue) and manage finances accordingly.
- They help businesses plan future sales goals.
- They also serve as the basis for additional compensation for sales teams (commissions and incentives).
Sales metrics can be a domain of buzzwords that are easy to get lost in. In this guide, we will focus on relevant key metrics for each functional area in sales, and elaborate on their use cases.
Sales Performance Metrics
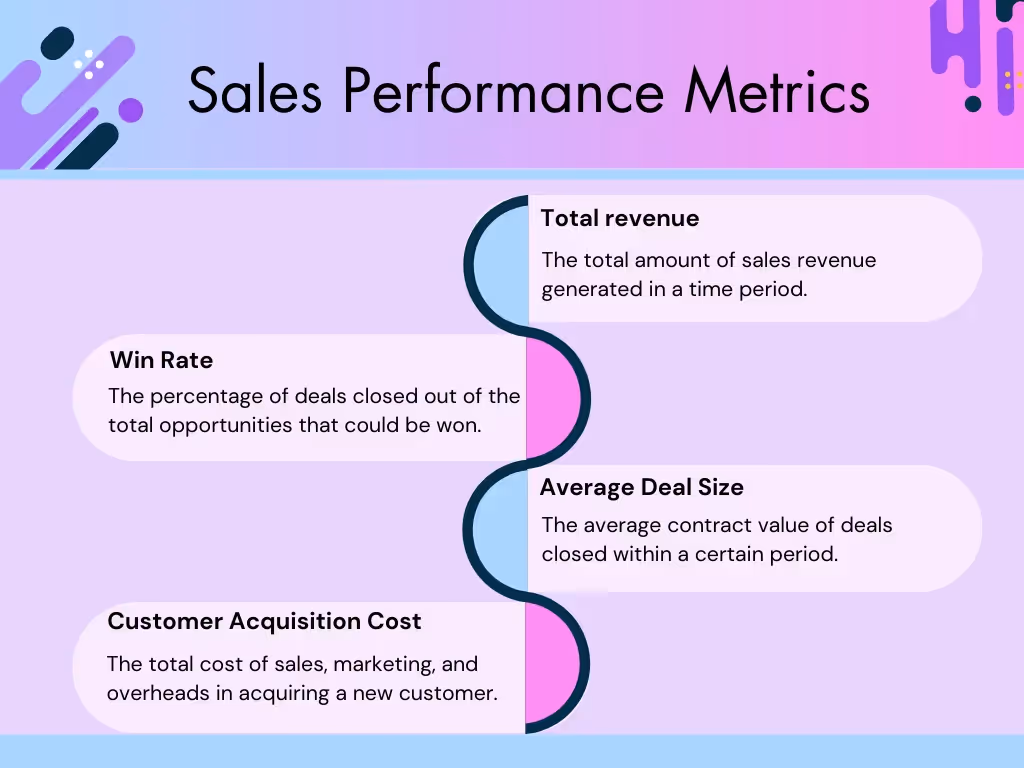
Sales performance metrics are the metrics that represent sales performance directly- such as revenue created, deals won, etc.
They are the primary metric used to calculate commissions and incentives (additional compensation) for sales teams.
Total Revenue
Total revenue refers to the overall income generated from sales activities over a period of time. It is the leading indicator of business performance. It includes money generated from selling to new customers as well as upselling and cross-selling to existing customers. It is an important metric for key stakeholders such as C-suite employees, stakeholders of the company such as investors, etc.

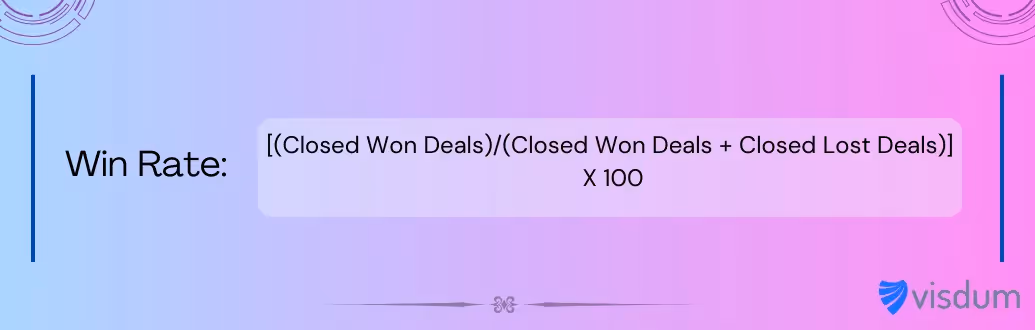
Win Rate
Win rate refers to the number of deals that are successfully closed (Closed Won) out of a pool of opportunities that could have been successfully closed. It is essentially the success rate at the opportunity stage of deals. It signifies how effective deal closure strategies of an organization are.
Average Deal Size
Average Deal Size refers to the average amount of money that comes in for a business on the closure of each deal. It is a key metric to strategize on new avenues in sales, as well as ascertain profitability in the current strategy.
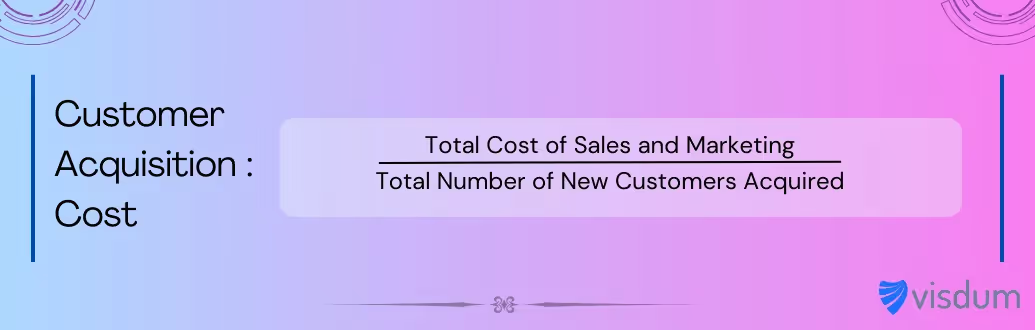
Customer Acquisition Cost (CAC)
Customer Acquisition Cost (CAC) refers to the total cost incurred in acquiring a new customer including all marketing expenses, sales staff salaries, commissions, overhead, etc. It signifies how expensive every new customer is to an organization. It is essential to track to keep expenses under control and oversee profitability. If the CAC is higher than the return from a customer over their lifetime, the company will make losses no matter how many customers they onboard.
Also Read: Top Practices for Sales Performance Management
Customer Success Metrics
Completing a sale is not the end of the sales journey. Now that customers have purchased a solution, the next step is to keep driving revenue from them by upselling and cross-selling, and keeping them satisfied and retained. Some key customer success metrics are:
Cross-sell rate and Upsell Rate
Cross-selling refers to selling other products/services that your organization also offers to existing customers. Cross-selling rate refers to the percentage of existing customers who successfully buy other products or services. Similarly, upselling refers to the practice of selling upgrades or higher tiers of the same product to existing customers. Upselling rate is the percentage of existing customers who are successfully sold upgraded or higher versions of a product.
Customer Satisfaction Score (CSAT)
A metric that measures how satisfied customers are with a specific interaction, product, or service. It's typically measured through surveys asking customers to rate their satisfaction on a scale (usually 1-5 or 1-10). The CSAT score is calculated by dividing the number of customers satisfied (those who selected 4 or 5) by the total number of respondents and multiplying by 100 to get a percentage. It is one of the most important customer success metrics.
Net Promoter Score (NPS)
A customer loyalty metric that measures how likely customers are to recommend your product/service to others. It's calculated based on responses to the question "How likely are you to recommend us?" on a 0-10 scale. Customers are categorized as Promoters (9-10), Passives (7-8), or Detractors (0-6). NPS = (% Promoters) - (% Detractors), resulting in a score from -100 to +100.
Customer Health Score
A predictive metric that indicates how likely a customer is to grow, maintain, or churn based on various indicators. It combines multiple data points such as product usage, support tickets, engagement levels, NPS scores, and payment history into a single score. Usually displayed as Red (at risk), Yellow (neutral), or Green (healthy), or on a numerical scale.
Time-to-Value
The length of time it takes for a new customer to realize the promised value or first significant benefit from your product or service. It measures the period between when a customer purchases your solution and when they achieve their first desired outcome. A shorter time-to-value typically leads to better customer satisfaction and retention. It is one of the sales metrics that are difficult to measure and, hence, is rarely used.
Sales Productivity Metrics
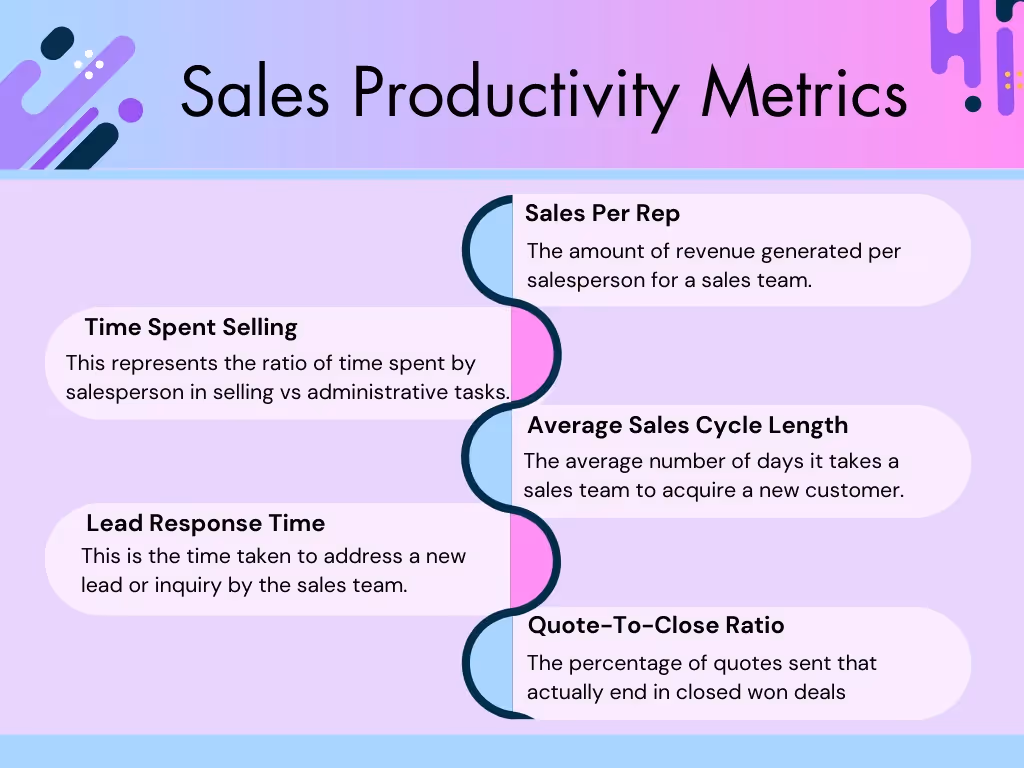
These are the metrics that show the efficiency of an organization's sales processes. It is essential to keep making process improvements to get the most out of your sales team, and sales leaders often rely on these metrics to get an idea of which areas need improvement.
Sales Per Rep
The total revenue or number of deals an individual salesperson generates over a specific period (usually monthly, quarterly, or annually). It is calculated by dividing total revenue or deals by the number of sales representatives. This metric helps measure individual performance and productivity to set benchmarks for the sales team.
Time Spent Selling vs. Administrative Tasks
The ratio between time spent on direct selling activities (calls, meetings, presentations) versus administrative work (data entry, paperwork, internal meetings). It is usually expressed as a percentage. The ideal ratio is 60-70% selling time to 30-40% administrative time. Helps identify efficiency opportunities and resource allocation needs.
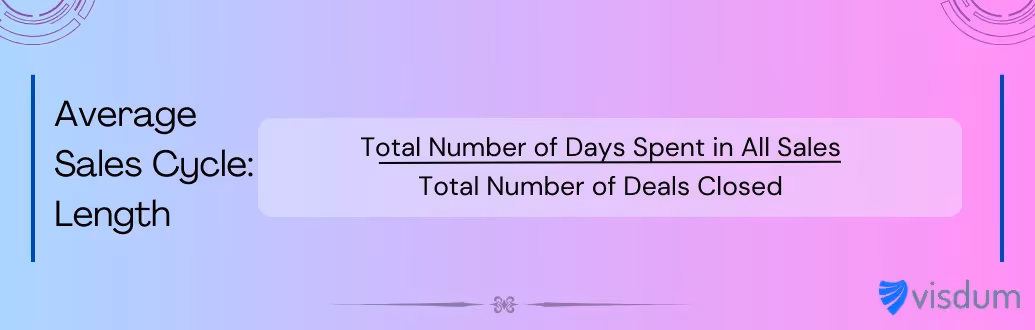
Average Sales Cycle Length
The average sales cycle length is the average time it takes to convert a lead into a paying customer, measured from first contact to closed deal. It is calculated by adding all sales cycle lengths in a time period and dividing by the number of deals closed in that period. Shorter cycles typically indicate more efficient sales processes and better qualification of leads.
Lead Response Time
It is the average time taken to respond to a new lead or inquiry. It is measured from when a lead is received to the first contact attempt by sales. The industry benchmark is often under 5 minutes for web leads. It is a crucial metric as faster response times typically correlate with higher conversion rates and the response rates drop as the delay becomes larger.
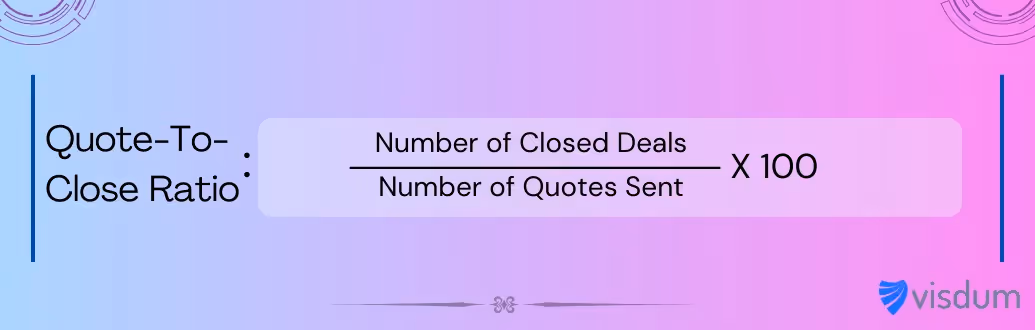
Quote-to-Close Ratio
The percentage of quotes or proposals that convert into closed deals. It is calculated by dividing the number of won deals by the total quotes sent, multiplied by 100. This metric helps evaluate proposal effectiveness and the opportunity qualification process. Industry averages vary but typically range from 15-30%.
Sales Activity Metrics
These metrics track day-to-day activities that fuel further stages of the sales process. Mainly, lead generation metrics are referred to as sales activity metrics. These are important sales metrics as they serve as the bread and butter for sales.
Number of Calls/Emails Made
The total volume of outbound sales communications (calls placed and emails sent) by a sales rep in a given period. This includes cold calls, warm calls, follow-ups, and email outreach attempts. It's a fundamental activity metric that indicates sales effort and helps establish baseline productivity standards.
Number of Meetings Scheduled
The total count of sales meetings, demos, or presentations scheduled with prospects or customers during a specific timeframe. Simply put, this is the number of leads generated. This metric tracks a salesperson's ability to generate interest and move prospects further into the sales pipeline. It's often correlated with eventual closing success.
Number of Proposals Sent
The total quantity of formal sales proposals or quotes sent to qualified prospects resulting in sales opportunities. This metric indicates pipeline progression and sales momentum. It's typically measured monthly or quarterly and helps predict future revenue based on historical proposal-to-win rates.
Conversion Rates
The percentage of successful transitions between sales stages (e.g., lead to a meeting, meeting to a proposal, a proposal to close, etc.). They are calculated by dividing the number of successful conversions by total attempts at each stage. This helps identify bottlenecks in the sales process and areas needing improvement (stages at which deals typically fall through). For example, if the total amount of leads generated is high, but the proposals sent are low, then the meetings must have some bottleneck.
Follow-up Contact Rate
The percentage of prospects who receive follow-up contact after initial interaction. It measures the sales team's persistence and adherence to follow-up protocols. It is widely known that most prospects do not respond upon first contact. It includes tracking multiple touchpoints across different channels and timing between follow-ups.
Sales Pipeline Metrics
Sales pipeline metrics show leadership how deals are moving through sales stages and what effect current sales strategies are having on deals. They represent sales effectiveness in being able to move deals forward.
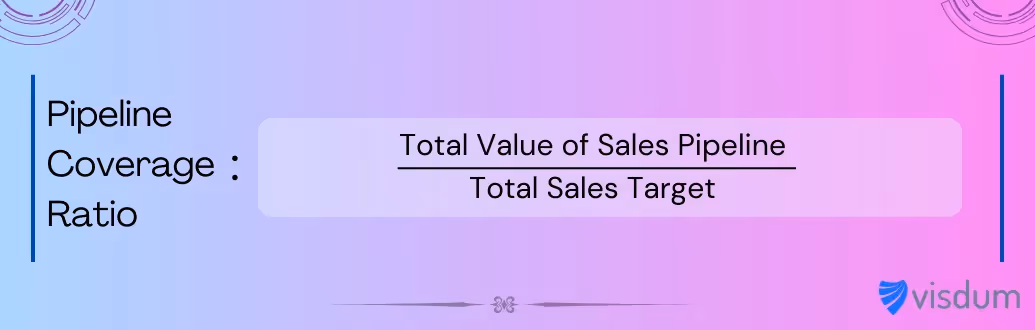
Pipeline Coverage Ratio
This sales metric represents the ratio between the total pipeline value and the total sales target/quota. Typically, a healthy ratio is 3-4x of quota, meaning if your quarterly target is $100K, you need $300-400K in pipeline opportunities in that quarter. This ratio helps ensure enough opportunities to hit sales targets and business goals accounting for normal win rates and fallout.
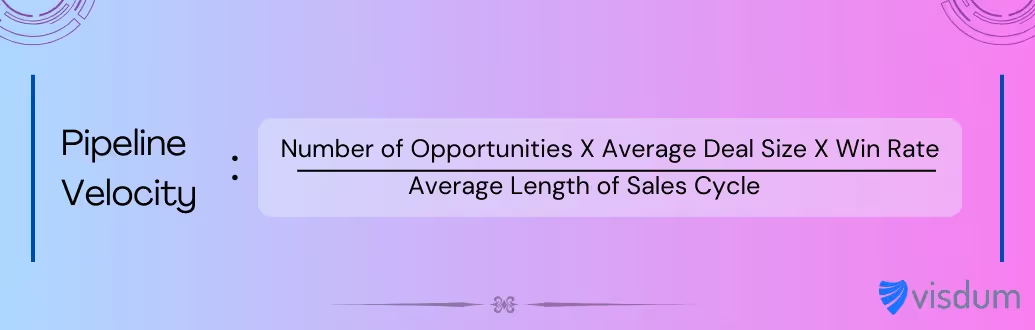
Pipeline Velocity
The speed at which opportunities move through your sales pipeline is known as the pipeline velocity. It represents how fast leads are being converted into customers. It is calculated by using 4 other sales metrics- win rate, number of opportunities, average deal size, and length of sales cycle. A higher pipeline velocity indicates a more efficient sales process and faster revenue generation.
Average Time Spent in Each Stage
The typical duration opportunities remain in each pipeline stage before advancing or dropping out. It is measured by tracking entry and exit dates for each stage. Longer-than-average stays in any stage can indicate problems requiring attention or additional resources. It is essential to maintain a smooth and nimble stage transition workflow to ensure revenue growth.
Pipeline Value by Stage
The total monetary value of all opportunities within each pipeline stage. Calculated by summing the potential revenue of all deals in each stage. This sales metric helps forecast revenue and identify stages where the highest value opportunities typically sit or stall. Optimizing each stage of your sales cycle requires knowing where the highest gains can be made, hence, pipeline value by stage is an important metric.
SaaS Sales Metrics
SaaS (Software as a Service) is a vertical of software sales in which software platforms are sold at monthly subscription prices, making the sales process entirely different from normal sales. A monthly subscription means a recurring revenue source and a greater emphasis on keeping customers retained, as the barrier to exit is fairly low.
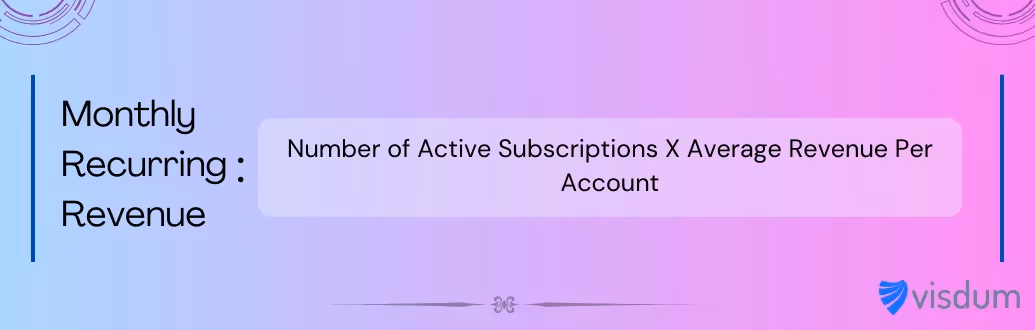
Monthly Recurring Revenue (MRR)
Monthly Recurring Revenue (MRR) refers to the total amount of revenue coming in each month from the existing customer base's monthly subscription payments. It is the most useful metric in saas sales metrics. This is what makes SaaS so appealing, as once the sale has been made, a fixed amount of revenue keeps coming in every month until the customer chooses to exit.
Annual Recurring Revenue (ARR)
Annual Recurring Revenue (ARR) is the combined value of all recurring subscription payments that a SaaS company expects to earn over a year. It is the total amount of money that a company can expect to earn every year till the contract ends, upgrades, changes, etc. For example, If a contract worth $36,000 is sold to a customer for a 3-year duration with monthly payments, the MRR is $1000 and the ARR (Annual Recurring Revenue) is $12,000.
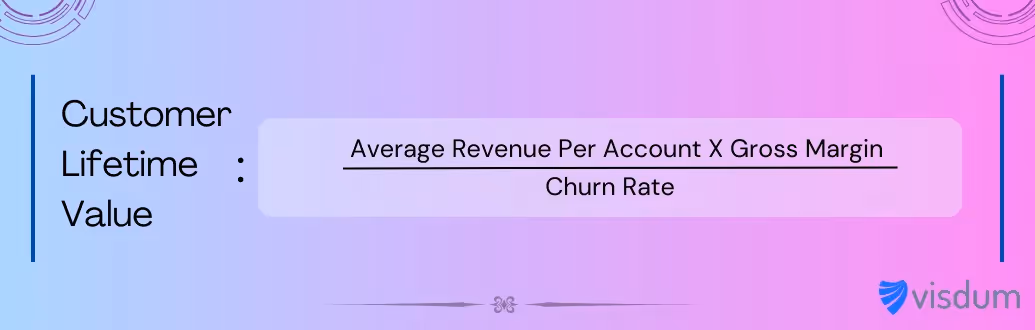
Customer Lifetime Value (CLV)
Customer Lifetime Value (CLV or CLTV) is the total amount of money a SaaS company can expect to earn from a customer during their entire business relationship. It is a projected figure based on the Average Revenue Per Customer (ARPA), existing churn rate, and gross margin. It is important to know this sales metric to figure out where the best deals are and which customers need to be focused upon more.
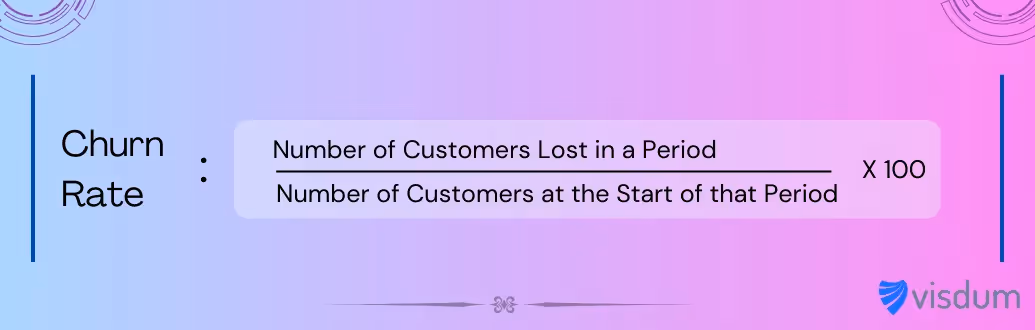
Churn Rate
Churn rate is a crucial SaaS metric. It represents the percentage of customers (from a total number of customers) who end their contract (close their subscription) in a certain time period (monthly, quarterly, etc.). Since SaaS companies generate recurring revenue (MRR and ARR), customer churning directly reduces the MRR and ARR when that subscription is closed. A high churn rate indicates that customers are not satisfied with the software or solution.
Customer Retention Rate
Customer Retention Rate (CRR) refers to the ratio of customers preserved over an amount of time (Year-on-Year for example). It is an important metric because creating new customers is much harder than retaining and generating revenue from existing customers. A low customer retention rate indicates that customers are not satisfied with the service/product they are getting.
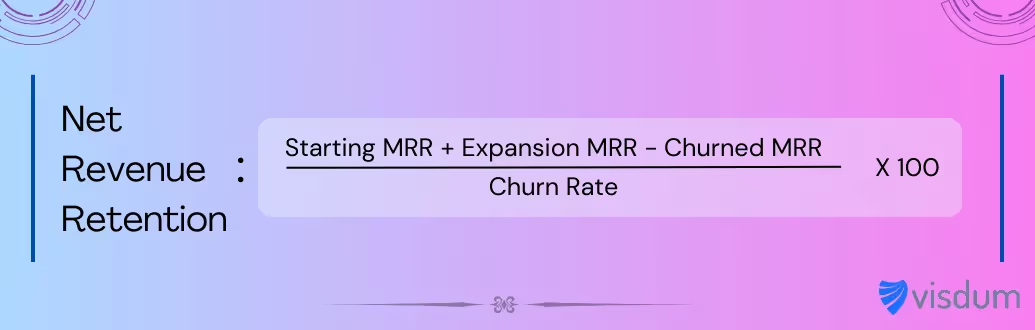
Net Revenue Retention (NRR)
Net Revenue Retention is a more refined way of measuring SaaS revenue compared to MRR and ARR. It is the percentage of the total revenue from existing customers over a time period retained when going into the next period, factoring in upgrades, downgrades, churn, etc. It provides better information regarding which products and which customers are actually working as assets for the company compared to the common revenue sales metrics in SaaS- MRR and ARR.
Sales Compensation Metrics
Sales is an area of business where performance is more dependent on compensation than any other. Sales teams are compensated via both base pay and commissions on the sales they make, hence, sales compensation is a huge industry. However, there are glaring problems due to this, such as complicated spreadsheets carrying all sales compensation formulas and calculations.
Visdum is a sales compensation software that ensures that all sales comp calculation are automated, leading to multiple hours being saved and much greater visibility for sales teams into their compensation structures.
Let's take a look at some of the major sales compensation metrics.
Commission Rate
Commission rate or sales commission rate refers to the percentage of the sales value given as an incentive to the salespersons responsible for closing the deal. For example, if the commission rate for a salesman is 5%, then he receives 5% of the contract value that he helped close. There are different commission rates for SDRs who generated the leads, AEs who closed the deal, etc. i.e., every sales team member who helped bring a deal to its closure receives a commission typically.
On-Target Earnings (OTE)
On-target earnings refers to the total compensation a salesperson can expect to earn if they complete 100% of other performance targets. It is the sum total of their base compensation and total target incentive at 100% target completion. OTE is an important metric that is decided in conjunction with the quota. Companies typically follow an industry-wide quota-to-OTE ratio. Typically, the sales quota is 5x to 8x of OTE.
Ramp Time to Full Productivity
The time period it takes for a new sales hire to reach their expected performance level or quota attainment. This metric measures how quickly salespeople become fully effective after joining, typically tracked from their start date until they consistently hit target performance metrics. It helps organizations understand onboarding effectiveness and forecast when new hires will meaningfully contribute to revenue.
Compensation to Revenue Ratio
The total amount spent on sales compensation (including base salary, commissions, and bonuses) is divided by the revenue generated. This metric shows what percentage of revenue goes to paying the sales team, helping companies evaluate if their compensation structure is financially sustainable and aligned with business goals. It is also known as the Compensation Cost of Sales (CCOS).
Quota Attainment
Quota attainment is a crucial and direct measure of a sales rep's effectiveness. It is the percentage of the sales quota that a salesperson has successfully achieved (in terms of revenue generated via the deals they close). It is important to study the relation between quota attainment and incentive plans, low quota attainment rates indicate a lack of motivation and a need to revise the compensation structure for sales. It is the most basic of all sales metrics for designing and implementing incentive plans.
Wrapping Up
While keeping track of metrics is a good practice, teams should ensure that they are not too fixated on quantitative evaluations of sales performance. Chasing revenue endlessly may cause them to ignore qualitative aspects such as customer quality, leading to high churn rates. Similarly, performance tracking solely on the basis of metrics can lead to dissatisfaction in sales team members in changing business conditions where closing deals might not be completely in the hands of sales teams.
Hence, the best way is to track these metrics openly and flexibly, allowing for two-way communication and changing targets by adapting to the current business landscape.
Want to improve your sales compensation process? Visdum is a sales compensation software that automates commission calculation, saving hours each week and drastically improving commission visibility for sales reps, leading to substantial increase in performance.
FAQs
What are the leading sales metrics?
Leading metrics are predictive indicators that signal future sales performance. These include activities that happen before a sale closes: number of calls made, emails sent, meetings scheduled, proposals submitted, and new opportunities created. Pipeline metrics like opportunities created and qualified leads are also leading indicators since they predict future revenue.
What are the lagging sales metrics?
Lagging metrics measure past performance and outcomes that have already occurred. Key lagging indicators include total revenue generated, number of deals closed, win rate, average deal size, and quota attainment. While valuable for evaluating performance, these metrics can't be directly influenced in real time since they reflect past activities.
What is a KPI in sales?
Key Performance Indicators (KPIs) are quantifiable measurements used to evaluate the success of sales activities against specific objectives. Examples include revenue targets, conversion rates, and customer acquisition costs. KPIs should be specific, measurable, achievable, relevant, and time-bound (SMART) to effectively track progress toward sales goals.
What is a KRA in sales?
Key Result Areas (KRAs) are the critical responsibilities and outcomes expected from sales professionals. These include revenue generation, market expansion, customer relationship management, and pipeline development. While KPIs measure specific metrics, KRAs are broader areas of responsibility that define a sales role's core purpose.
What is a sale indicator?
A sales indicator, also known as a sales metric, is a signal that indicates performance and objective completion in sales roles. Sales indicators help company leadership understand the effectiveness of their sales strategies. Leading indicators in sales inform about projected performance in the future, and lagging sales indicators inform about the performance figures for past periods.
How to calculate sales productivity?
Sales productivity is typically calculated by dividing total sales output (revenue generated) by total sales input (resources invested, including time and costs). The formula is: Sales Productivity = Revenue Generated / Resources Invested. This can be measured per rep, team, or organization-wide to assess efficiency.
What is customer acquisition cost?
Customer Acquisition Cost (CAC) represents the total cost of acquiring a new customer, including marketing expenses, sales salaries, commissions, and overhead. The formula is: CAC = Total Sales & Marketing Costs / Number of New Customers Acquired. This metric helps evaluate the efficiency of sales and marketing efforts.
How to calculate customer lifetime value?
Customer Lifetime Value (CLV) calculates the total revenue expected from a customer throughout the entire business relationship. The basic formula is: CLV = Average Purchase Value × Average Purchase Frequency × Average Customer Lifespan. For subscription businesses (SaaS), multiply the average monthly recurring revenue by the average customer lifespan in months.
.avif)